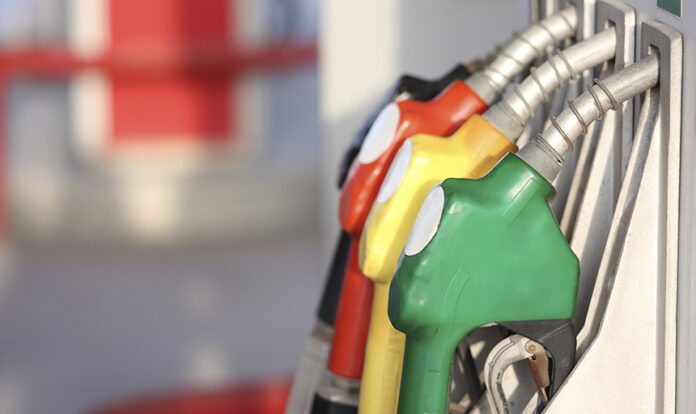
After weeks of little movement, the national average for a gallon of gas increased by about 4 cents since last week to $3.12. Even though the price of crude oil remains below $70 a barrel, prices at the pump are going up as more refineries make the seasonal switch to summer-blend gasoline. Summer-blend gas is less likely to evaporate in warmer temperatures and is more expensive to produce.
Today’s national average for a gallon of gas is $3.12, 4 cents lower than a month ago and about 40 cents lower than a year ago. Virginia’s gas average is $2.93 today, up 7 cents in a week, down 9 cents in a month and down 44 cents from this day a year ago.
According to new data from the Energy Information Administration (EIA), gasoline demand decreased from 9.18 b/d last week to 8.81. Total domestic gasoline supply decreased from 241.1 million barrels to 240.6. Gasoline production increased last week, averaging 9.6 million barrels per day.
The national average per kilowatt hour of electricity at a public EV charging station stayed the same at 34 cents. Virginia’s average per kilowatt hour of electricity at a public EV charging station is also 34 cents today.
GAS PRICES FROM AAA
Average price per gallon of self-serve, regular gasoline.
Gas prices provided by AAA, http://gasprices.aaa.com/
|
Today |
Weekly Change Up/Down |
Last Month |
Last Year |
|
|
National |
$3.12 |
Up 5 cents |
$3.16 |
$3.51 |
|
Virginia |
$2.93 |
Up 7 cents |
$3.02 |
$3.37 |
|
Charlottesville |
$2.96 |
Up 4 cents |
$3.10 |
$3.39 |
|
Fredericksburg |
$2.97 |
Up 29 cents |
$3.05 |
$3.35 |
|
Harrisonburg |
$2.87 |
Up 3 cents |
$3.18 |
$3.39 |
|
Norfolk Area |
$2.95 |
Up 11 cents |
$2.91 |
$3.37 |
|
Richmond |
$2.94 |
Up 12 cents |
$3.07 |
$3.37 |
|
Roanoke |
$2.86 |
Up 5 cents |
$2.97 |
$3.33 |
Oil Market Dynamics
At the close of Wednesday’s formal trading session, WTI rose 26 cents to settle at $67.16 a barrel. The EIA reports that crude oil inventories increased by 1.7 million barrels from the previous week. At 437.0 million barrels, U.S. crude oil inventories are about 5% below the five-year average for this time of year.
Quick Gas and Electricity Stats
Gas
The nation’s top 10 most expensive gasoline markets are California ($4.64), Hawaii ($4.53), Washington ($4.09), Nevada ($3.74), Oregon ($3.73), Alaska ($3.39), Illinois ($3.38), Arizona ($3.34), Idaho ($3.26), and Pennsylvania ($3.22).
The nation’s top 10 least expensive gasoline markets are Mississippi ($2.66), Oklahoma ($2.69), Kentucky ($2.69), Tennessee ($2.69), Louisiana ($2.73), Alabama ($2.74), Texas ($2.76), Arkansas ($2.76), South Carolina ($2.78), and Kansas ($2.80).
Electric
The nation’s top 10 most expensive states for public charging per kilowatt hour are Hawaii (56 cents), West Virginia (46 cents), Montana (45 cents), South Carolina (42 cents), Tennessee (42 cents), Idaho (42 cents), Alaska (41 cents), Kentucky (40 cents), New Hampshire (40 cents), and Louisiana (39 cents).
The nation’s top 10 least expensive states for public charging per kilowatt hour are Kansas (22 cents), Missouri (25 cents), Nebraska (26 cents), Iowa (26 cents), North Dakota (26 cents), Delaware (27 cents), Michigan (29 cents), Texas (39 cents), Utah (29 cents), and Washington, DC (30 cents).
AAA has a variety of resources to help motorists save on fuel:
- Fuel Price Finder (http://www.AAA.com/fuelfinder) locates the lowest fuel price in your area.
- AAA Gas Cost Calculator (http://gasprices.aaa.com/aaa-gas-cost-calculator/) helps budget travel expenses.
- TripTik Mobile (http://www.aaa.com/mobile) plots fuel prices along your travel route.

