The Virginia Index of Consumer Sentiment is 90.4, an eight-point slide since August 2016 (the record high) and down three points since last quarter, but it remains above the series average (85.9.) Sentiment is below the preliminary national May value of 97.7. Republicans and Democrats remain divided, particularly about the future health of the economy. The short-term inflation expectation in Virginia is 2.2 percent and is slightly lower than the national value of 2.6 percent.
Figure 1. Virginia Consumer Sentiment values vs. index lifetime average
Black bars are Virginia Index of Consumer Sentiment (VAICS) values; blue line is the VAICS lifetime average. The VAICS began in November 2011.
Virginia sentiment continues slide, but above trend
The Virginia Index of Consumer Sentiment (VAICS) is 90.4 in May, down three points since the last quarter, but above the index average of 85.9. Figure 2 illustrates sentiment values for Virginia and the U.S. over the past two years. Sentiment in Virginia is lower than the national preliminary May value of 97.7, which is just off its decade high hit in January 2017 (98.5). Strong economic indicators support the sentiment values. Virginia unemployment remains low (3.8%). The state unemployment rate continues to fall due to increases in employment and the labor force. Non-farm wages increased 1.2 percent over the past 12-months while GDP grew 1.5 percent in the last quarter of 2016 (annualized rate). The largest contributors to the GDP growth in Virginia are the professional and business services.
Figure 2. Consumer sentiment over time, Virginia and the United States
US data from Michigan’s Survey of Consumers 5/14/2017; blue line is US Consumer Sentiment (monthly); black line is a three-period moving average; red bars are VA Consumer Sentiment
Figure 3 illustrates the three sentiment indexes for the Commonwealth and the nation. Virginians are slightly less optimistic than the nation overall which is driven largely by lagging beliefs about current conditions. The Virginia Index of Current Conditions (VAICC) is 98.0, down two points from last quarter. Thirty-seven percent of those surveyed reported improved household finances over a year ago, primarily citing higher incomes. Additionally, 55 percent believe that now is a good time to buy large durable items, largely due to low prices.
Figure 3. Consumer Indexes May 2017, Virginia and United States
US data from the University of Michigan’s Survey of Consumers, May 2017.
The Virginia Index of Consumer Expectations (VAICE) is 85.6 in May, down by more than three points since last quarter. The preliminary national May 2017 measure of expectations is 88.1 indicating that Virginians are slightly less optimistic about the future of the economy than the nation as a whole. More Virginia respondents believe that the overall economy will prosper over the next five years (35.6%) than believe it will contract (29.0%). Forty-one percent expect their household finances to improve in the coming year, while 12 percent anticipate their personal finances to decline. Improved wages and income are likely the foundation of the optimism.
Parties split on economic expectations
Dramatic differences persist by party, particularly pertaining to expectations. The VAICE for Republicans is 121.9 compared to 66.1 for Democrats, a 55.8-point difference but a convergence since last quarter. Republicans first became more optimistic about the economy after the November 2016 election. Figure 4 shows shares of positive and negative responses to questions about the future of the economy by party. Democrats show the least pessimism about their personal finances, with the majority expecting no change. Their greatest concern pertains to business conditions and the overall economy. Republicans, likely spurred by potential tax cuts, are optimistic about their personal finances, business conditions, and the economy as a whole.
Figure 4. Economic expectations by party
Regional Sentiment Strong Across the Commonwealth
Consumer sentiment for the six regions in the Commonwealth is shown in Figure 5. Comparing regional index values over time is problematic due to the small sample size within each region. Figure 5 shows the average regional value of the VAICS (November 2011-May 2017, red dot), the typical variation from that average (black line), and the current value (blue dash). This depiction provides a meaningful way to examine the current regional VAICS values to their usual values. In May 2017, Southside, Southwest Virginia, and Shenandoah Valley show above normal optimism while the remainder of the Commonwealth is within boundaries suggesting opinions are no different than is typical.
Figure 5. Regional VAICS Mean and Current Value
Regional VAICS values on the y-axis; mean regional VAICS (red dot), sample standard deviation of regional mean (black line), current regional VAICS (blue dash)
Inflation expectations fall
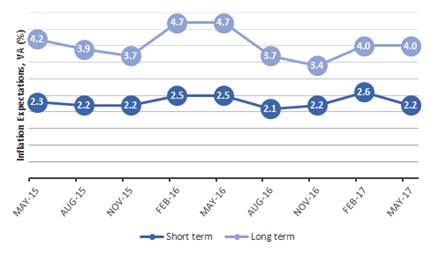
The short-term inflation expectation, shown in Figure 6, returned to the November 2016 level of 2.2 percent, down 0.4 points since last quarter, and below the national expectation of 2.6 percent. The long-term inflation expectation held its February 2017 value of 4.0 percent this quarter in the Commonwealth and remains well above the national estimate of 2.3 percent. Both short- and long-term inflation expectations are fairly stable over time. Predictable prices are crucial to long-run investment, economic growth, and job creation.
Figure 6. Short- and long-term inflation expectations past two years, Virginia
Short- and long-run price expectations are weighted means.
Interviewing for The Roanoke College Poll was conducted by The Institute for Policy and Opinion Research at Roanoke College in Salem, Va. between May 7 and May 12, 2017.


